Welcome to the world of Prometheus, where monitoring and alerting just got a whole lot easier. In this tutorial, we will guide beginners through the basics of Prometheus and show you how to harness its power for your own projects. Let’s dive in!
Understanding Prometheus
![]()
Prometheus is a powerful **monitoring** and **alerting** tool used in the world of **cloud computing** and **software development**. It helps to keep track of various **metrics** from your **applications** and **systems**, allowing you to easily identify and resolve any issues that may arise.
One of the key features of Prometheus is its ability to **scrape data** from different sources using **HTTP** protocols, such as **web servers** and **databases**. This data is then stored in a **time series database**, which enables you to visualize and analyze it using **graphs** and **charts**.
To get started with Prometheus, you will need to **download** and **install** the software on your **server** or **local machine**. Once installed, you can configure Prometheus using **YAML** files to specify the **targets** you want to monitor and set up **alerting rules**.
Prometheus also provides a **web interface** where you can view **metrics**, **graphs**, and **dashboards** to gain insights into the performance of your **applications**.
Integrating Prometheus with Workloads
![]()
To integrate Prometheus with your workloads, start by installing and configuring Prometheus on your system. Make sure to adjust the configuration file to specify the targets that Prometheus should monitor. You can also use YAML files to define the rules for alerting and recording.
Once Prometheus is set up, **create** dashboards to visualize the metrics collected from your workloads. Use **PromQL** to query and analyze the data collected by Prometheus. This powerful query language allows you to filter, aggregate, and manipulate time series data.
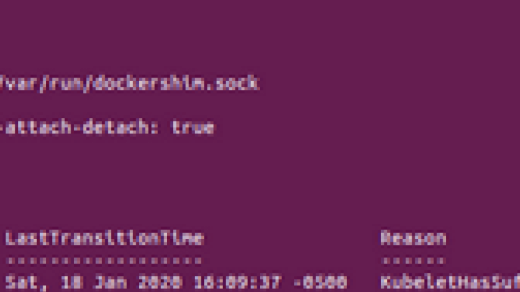
If you are using Kubernetes to manage your workloads, you can easily integrate Prometheus with Kubernetes **API** to monitor your containers and pods. Prometheus also supports service discovery, which makes it easy to add new targets dynamically as your infrastructure scales.
By integrating Prometheus with your workloads, you can gain valuable insights into the performance and health of your applications. With Prometheus, you can easily track metrics such as CPU usage, memory consumption, and latency. This data can help you identify bottlenecks, debug issues, and optimize your applications for peak performance.
Prometheus Metrics Types and Format
| Metric Type | Description | Format |
|---|---|---|
| Counter | Monotonically increasing value | Counter(name) |
| Gauge | Instantaneous value that can go up or down | Gauge(name) |
| Summary | Tracks the count, sum, min, max, and quantiles of observations | Summary(name) |
| Histogram | Similar to a summary but also counts observations into buckets | Histogram(name) |
Challenges of Collecting Prometheus Metrics
When collecting Prometheus metrics, there are several challenges that beginners may face. One common issue is understanding the configuration file setup, as incorrect configurations can lead to inaccurate data collection. It is important to carefully review the configuration settings to ensure that the metrics are being collected from the correct sources.
Another challenge is setting up the export of metrics to a dashboard for easy monitoring. Beginners may find it difficult to navigate the process of exporting metrics and displaying them in a user-friendly format. Utilizing resources such as tutorials or documentation can help simplify this process.
Additionally, troubleshooting issues with debugging and understanding the metrics being collected can be a hurdle for beginners. It is important to familiarize yourself with the Prometheus API and available resources for assistance when facing challenges with metric collection.
Deploying Prometheus on Kubernetes
To deploy Prometheus on Kubernetes, start by creating a Kubernetes cluster if you don’t already have one set up. Install **Prometheus** using Helm, a package manager for Kubernetes. Helm charts make it easy to deploy complex applications like Prometheus with pre-configured settings.
Set up a **namespace** for Prometheus to keep it isolated from other applications. Configure Prometheus to scrape metrics from your applications by defining **ServiceMonitors**. These allow Prometheus to collect data from various services running on your Kubernetes cluster.
Create **alerting rules** in Prometheus to monitor your services and notify you of any issues. Set up **Grafana** to visualize the metrics collected by Prometheus. Grafana provides a user-friendly interface to create dashboards and gain insights from your data.
Monitor your Kubernetes cluster, applications, and services effectively by deploying Prometheus.